|
A Complex System for the Visualization of Music;
including the journey from 2D to Virtual Reality Jack Ox |
||||||
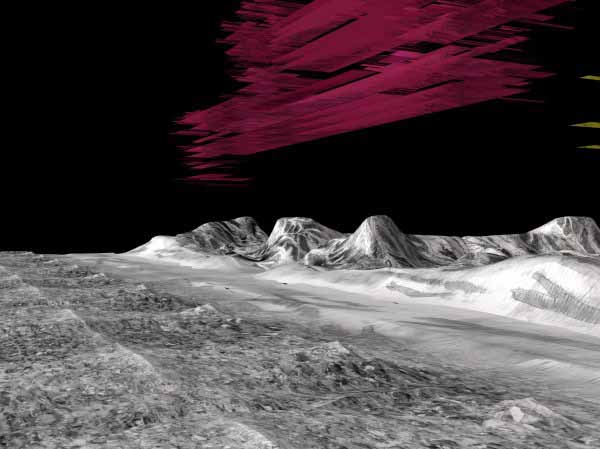
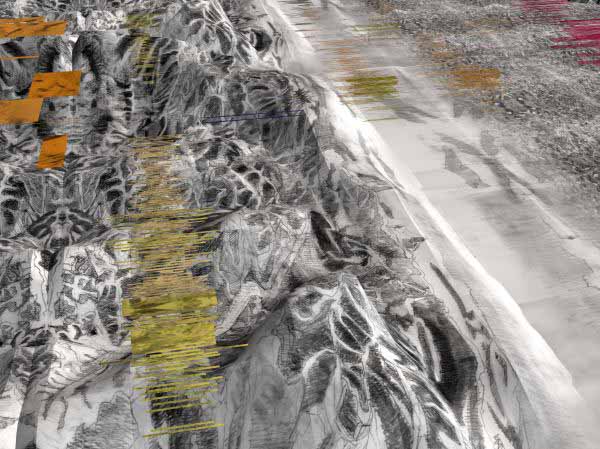
| 1.1. Introduction My long term interest has been to create and solve problems encountered in the visualization of music as an abstract phenomenon. This self-authored system for translating musical compositions into visual performance involves the interaction of multiple layers of information in a complex way. I have been developing and using an almost living, always expanding system for the specific purpose of making visual the structure of a variety of music. The art works which have emerged from this process have embodied principles of Intermedia as defined by Dick Higgins[1] the late avant-garde theorist and Fluxus artist. Intermedia is a completely different concept from multimedia, although it can be included in a multimedia environment. While with multimedia, content/information is presented in more than one medium simultaneously, Intermedia is a combinatory structure of syntactical elements which come from more than one medium but are combined into one. This “transformation” into another kind of entity is pointed to as an obligatory part of Intermedia by Yvonne Spielmann [2] in her analysis of digital film and video. I believe that it is the same phenomenon as the product of the interaction between independent systems in time and space in descriptions of Complexity. There is an unpredictability of outcome based on a sensitive dependence upon the initial conditions (the music). The final form can only be seen after going through the entire process, the transformation into the new form of Intermedia. 1.2 Collection of data: Analysis of music The first part of the analysis task is to determine what are the structural parameters of the piece of music to be visualized, or in other words, what are the operating principles? Which data sets should be collected? Does the composition exist within a diatonic/chromatic harmonic frame work, or is it composed from layers of carefully chosen timbres? These two approaches mean very different things and are therefore visually depicted with completely different color systems. I try to make a detailed analysis of each set of information which is present in all performances. For instance, if a piece of music can be reduced to a piano score then it is not dependent upon the timbre of different instruments in order to be that piece of music. Therefore when I was analyzing the Eighth Symphony of Anton Bruckner I made a traditional harmonic analysis, and for Kurt Schwitters’ 41 minute sound poem called the Ursonate, I made a phonetic analysis instead. The Ursonate only uses one voice and therefore has no vertical harmony. Furthermore the vocabulary is based in language as all of the spoken/sung sounds are nonsense phonemes from German. A harmonic analysis would not have yielded meaningful information for translation of this composition. Nor would it have worked with music which depends upon carefully constructed timbre as its structure. There are elements which have been contained in all of the compositions which I have visualized. They include patterns of rising and falling melodic lines, changes in dynamics (loudness), and also the rhythmic units and patterns including their articulation. This information is either gleaned from written scores, as in my work with Bruckner; a writing down of every note heard by hand (or should I say by ear?) from an original audio performance of Kurt Schwitters reciting his Ursonate; or lastly, as in the case of The Virtual Reality 21st Century Color Organ, the information comes directly from MIDI files.[3] 1.3. Creation of corresponding data sets: Visual vocabularies 1.3.1 Images and their re-ordering One of the most important decisions to make is what kind of images will be used as the vocabulary through which the syntax of the music will be seen. I choose landscapes and/or architectural elements which are somehow close to the music, images which will carry meaning in style, structure, and/or historic connection. I gather them by making very high resolution photographs on location and then detailed pencil drawings in my studio often combining three or four photographs into one large view. It is important to make detailed, well rendered drawings so that during the extensive processing to come they will hold their character and be recognizable. These images are cut up and reordered based on the previously mentioned analyses of dynamic changes, melodic and rhythmic structures. There are changes of image scale to represent louder or softer music. The width of the units representing a single note or chord is determined by its corresponding time value and melodic changes create shifts in the vertical placement of image units in both the two dimensional and three dimensional versions. There is another cut and collage system I designed to indicate specific consonants when using phonetics as a basic operating system. When the visual units finally appear in their new abstract formations, the original representational themes become subliminal in their appearance to the viewer. These multi-varied changes have come about through complex interactions of multiple simple systems. Analysis of the overall form of the music determines how the images are used. In the Bruckner work I assigned images to the specific musical lines occupying the same place in the structure. For the Ursonate one image was chosen for each theme, and in the Color Organ images are attached to whole families of instruments. So, each image is itself a collection of data, containing content in both patterns of lines and colors and a connection of literal meaning.[4] The lines and volumetric shapes are cut up and rearranged according to other data sets taken from the syntax of the music. The representation of silences is another contextually based element. Should the silence be read as an empty instant of time, or is it in an equal balance of power with the “on” notes? For the work with Bruckner I made the silences in an image line white, so they could still carry a color which would indicate key. When visualizing the Ursonate I made the very bright, solid colors, encoding them by length of time ranging from a deep red for the longest though greenish yellow for a short breath. Because the Schwitters piece consists of only one voice and has a balance between voice and silence I felt the effect of the aural version needed an aggressive treatment in the visual version. The Color Organ is programmed for empty space, or a cessation of the musical structure when the note is off. 1.3.2 Transparent color systems We are now at a point of further bifurcation. A major part of the visual vocabulary which I have developed is based in the application of a transparent layer of color over the displaced and reordered images. Which information these overlaid color systems expresses is determined early on. For harmonically based music I developed the following system in order to visualize both harmonic movement and harmonic quality: For the first part I took a twelve step color wheel and superimposed it over a circle of fifths [5] , which is the circular ordering of keys with closely related keys being next to each other and those not related directly across from each other. This ordering is the same as the color wheel. I made the minor keys 3 steps behind in an inner wheel, also in emulation of the circle of fifths. As the music modulates through keys, the same pattern occurs with the movement through the colors. Harmonic quality refers to the relative dissonance or consonance of two or more notes playing at the same moment. It is a sliding scale between the two extreme ends of pure consonance and the most extreme example of dissonance within a given style of music. For the music of Bruckner a pure consonance is represented by a pure hue from the color/harmony wheel and extreme dissonance is represented by a 50-50 mixture of the original color and its complimentary color, i.e.. 50% orange with 50% blue. This makes a grey hue. I have made six steps between the ends, so as the transparent color becomes more grey it is also more dissonant. Since there is no vertical harmony in the single voiced Ursonate I transformed the previous harmonic quality system into one which maps how and where vowels are produced in the mouth. This system was developed at the Institute of Phonetics at the University of Cologne. The list of colors for unrounded vowels come from the warm side of the color wheel and rounded vowels are from the cool side. As the tongues moves down in the mouth to form different vowels, the color choice moves down the appropriate color list. Vowels which are formed in the front of the mouth, like “i” and “e”, are a pure color. vowels directly behind the teeth, like “I”, have a 10% complimentary color component, the next step back in the mouth is 20% complimentary, and so on until the back of the mouth, as in “o” or “u”, which has 50% complimentary color in the mixture. The last color system I created is based on timbre, which literally means the color of sound. A vital component of music which is structured on timbre is the combination of specific and differentiated sounds, much like a painter can choose to use color. Whereas the color system based on the circle of fifths maps harmonic movement and quality in order to visualize music which takes its structure from these concepts , this later system is effective with music when the actual sounds form the structure. I have created a list of over 130 colors which are organized by families of instruments occurring in a certain range (e.g. brasses going from yel-or for trumpet down to red for tuba, or the strings ranging from yel-gr for violin down to blue for double bass); and further modified by different mutes or playing techniques in the brass and for the strings, all of the different bowing techniques plucking techniques. 1.4. The 21st Century Virtual Reality Color Organ The 21st Century Virtual Reality Color Organ is a collaborative project with David Britton and myself as the principles and a growing list of generous contributors from both industry and high performance computing universities [6]. Britton is responsible for the graphics programming and the meta-architecture of the programming structure. I have contributed the concept, visual images, musical analysis, visualization systems and texture maps. The Color Organ is a computional system for translating musical compositions into visual performance. An instrument, like a musical instrument, it uses supercomputing power to produce 3D visual images and sound from MIDI files, and can play a variety of compositions. Performances take place in interactive, immersive, virtual reality environments such as the CAVE, VisionDome, or Immersadesk. Because it is a 3D immersive world the Color Organ is also a place; a performance space. The Organ consists of three basic parts: First there is the set of systems or syntax which consists of logarithmic transformations from an aural vocabulary to a visual one. Second, there is the 3D visual environment serving as a performance space, and also the visual vocabulary from which the 3D environment was modeled. This visual vocabulary consists of landscape and/or architectural images and provides the objects upon which the syntax acts. Finally comes the programming which makes possible the interaction of the first two parts. When the performance begins you are in this world of hand drawn landscapes which have been modeled into 3D. All of the landscapes are in black and white with the sky completely black. As the music plays a three dimensional colored and image embedded geometric structure takes shape in the space over the landscape. This is constructed from flat pictures of the landscape images representing the instrument family which produced them. They are colored a specific hue based on a timbre analysis of which instrument is being played and what the particular playing technique is at that moment. The saturation of the color reflects changing dynamics (loud and soft). These flat strips of landscape are placed up and down in vertical space by their pitch. A higher pitch will be higher in space and a low pitch will be placed closer to the landscape below. The width of the strips is controlled by the volume (attack) of the signal. After the music has been played there remains a complete sculpture which can be further explored in an interactive way. The viewer can move at will through the space and touch elements of the sculpture and hear the sound which originally produced it. Click to see some still shots from the Color Organ. Interactivity in a 3D environment gives the Organ another layer of complexity. The 2D wall works can be hundreds of feet long and therefore incorporate time into the viewing process, but it is a movement across a flat plane. When one is immersed in the Color Organ ’s 3D environment you have the ability to move in all directions in and around the image embedded, colored geometry which is created before your eyes as you hear the music which is producing it. After the music has finished playing the structure remains to be explored from an infinite number of viewpoints. The viewer will also be able to point to a musical artifact and hear the sound which produced it. The Color Organ will be able to function on two levels in the future. It will play pre-existent compositions as now, but Britton is re-doing the program architecture so that different musical parameters can be plugged in. The second goal we have is for the Organ to be able to translate the MIDI signals from live, improvising musicians, who could be located in different locations along the AccessGrid but the visualization and sound will appear including all parts in the immersive environments also located on the Grid. If the musicians are improvising it then becomes a complex adaptive system. There are many problems on internet 2, such as a lag of real time. However, musicians have been experimenting for a long time with long distant collaborations and have dealt with these problems. We are actively looking for partners to collaborate with us in production help and/ or financial support. We are also looking for architects and visual artists who would be interested in creating 3D environments and visual vocabularies to be added the the Color Organ as additional organ “stops”, literally creating visual voices for the instrument which are similar to the sound choices on a traditional organ. The complexity of theColor Organ will hopefully continue to grow as time goes on. |
||||||
 |
||||||
| Figure. 1. Still shot from the Color Organ showing musical structure generated by piano chords. |
||||||
 |
||||||
References
|
||||||